
Healthcare Data Analytics: The Complete Guide to Medical Practice Reporting, KPIs, Excel Dashboards, and Performance Improvement
Healthcare practices generate information every day through electronic health records (EHRs), appointment scheduling systems, billing platforms, referral workflows, and patient communications. However, collecting information is only the first step. The real value comes from understanding what the data reveals about a practice’s clinical processes, administrative efficiency, financial performance, and patient access.
Healthcare data analytics helps physicians and practice administrators turn operational information into useful reports that support informed decisions. Whether a practice operates from one office or manages multiple locations and providers, a structured reporting process can help identify performance trends, uncover workflow delays, and highlight areas that require further review.
This guide explains what medical practices should measure, which healthcare KPIs matter, how Excel and EHR dashboards can support reporting, and how practices can use analytics to improve day-to-day operations.
What Is Healthcare Data Analytics?
Healthcare data analytics is the process of collecting, validating, organizing, and interpreting healthcare information to identify patterns and measure performance.
For a medical practice, this may involve analyzing:
- Patient visits and appointment outcomes
- New-patient registrations and follow-up appointments
- Physician productivity and schedule utilization
- Referral sources and referral completion
- Medical billing, claims, denials, and collections
- Accounts receivable (A/R) and outstanding balances
- Insurance verification and authorization workflows
- Patient communication and scheduling turnaround times
- Clinical quality measures and selected patient outcomes
The appropriate metrics depend on the specialty, practice size, available data, and reporting objectives.
7 Benefits of Using Data Analytics In Healthcare
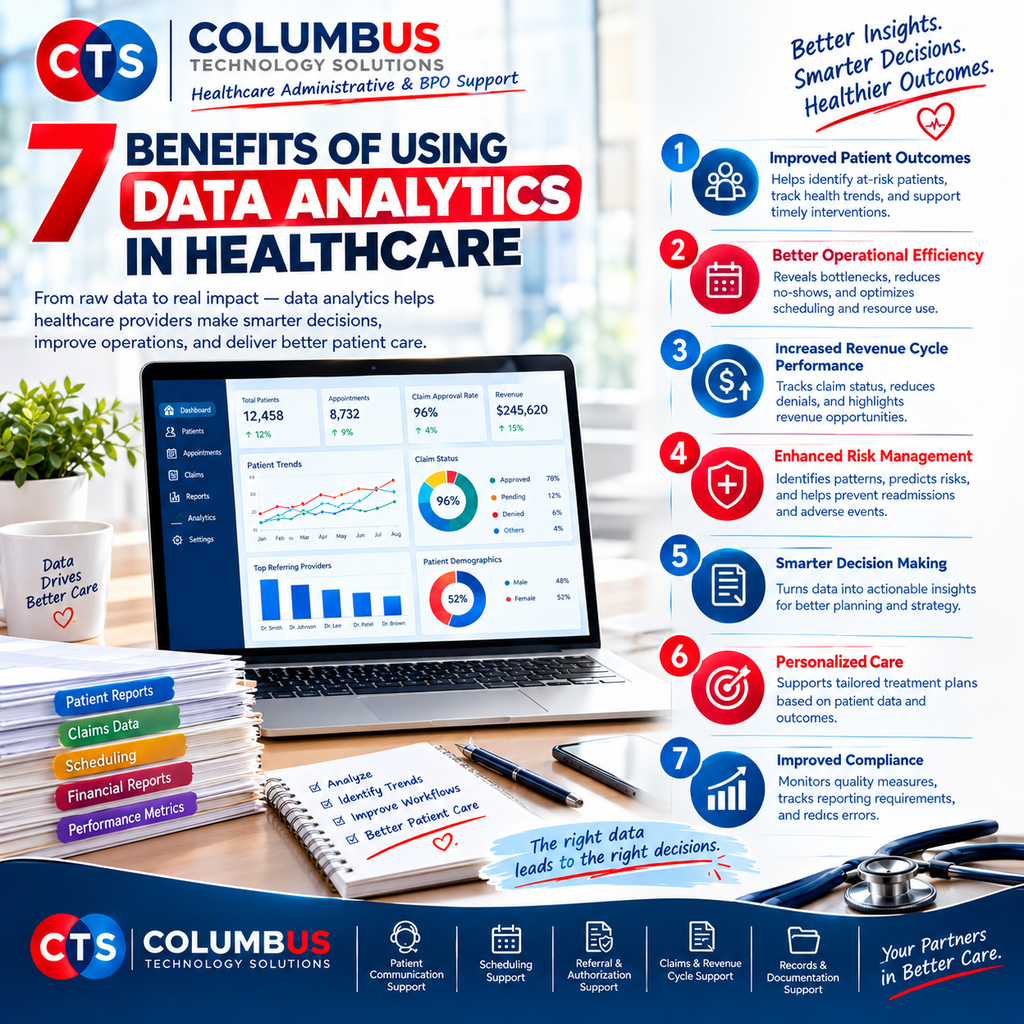
For a broader introduction to selecting relevant measures, read our guide: What Healthcare Data Should a Medical Practice Track?
1. Identify the Right Healthcare KPIs for Your Practice
Key performance indicators (KPIs) are measurable values used to monitor progress toward specific operational, financial, or quality objectives.
A useful KPI should answer a practical question. For example, a physician may want to know whether appointment availability is improving, while a practice administrator may need to understand why claims denials increased during the previous month.
Common healthcare KPIs include:
Patient access and scheduling
- Appointment requests received
- New patients scheduled
- Completed appointments
- Cancellation rate
- No-show rate
- Average time from referral to appointment
Practice operations
- Patient visits by provider
- Visit volume by location
- Schedule utilization
- Pending administrative tasks
- Referral processing time
Financial performance
- Charges and payments
- Claims submitted
- Claim denial rate
- Accounts receivable aging
- Days in accounts receivable
- Collections against a clearly defined financial target
Clinical quality
- Selected quality measure performance
- Eligible patient populations
- Follow-up completion
- Preventive care measures, where applicable
Not every practice needs every metric. The best approach is to select indicators that align with the practice’s goals and can be calculated consistently.
Learn more in our guide to What KPIs Should a Doctor’s Office Track?
2. Build a Physician Practice Dashboard
A physician practice dashboard brings important measures into one organized view. Instead of reviewing multiple spreadsheets and system reports separately, authorized users can see key results for a defined reporting period.
A practical dashboard might include:
- Total patient visits
- New-patient volume
- Appointment cancellations and no-shows
- Referral status and completion
- Provider-level performance measures
- Claims and denial trends
- Outstanding accounts receivable
- Monthly financial comparisons
- Selected quality measures
The dashboard should make it easy to compare current performance with previous periods or established targets. It should also allow users to investigate the underlying records when a result needs explanation.
For example, an increase in no-shows may be related to scheduling patterns, appointment reminders, transportation difficulties, or other factors. The dashboard identifies the trend; further investigation helps determine its possible causes.
Explore the details in What Should Be Included in a Physician Practice Dashboard?
You can also learn What Is a Healthcare KPI Dashboard? and How EHR Dashboards Help Physicians.
3. Use Excel for Medical Practice Reporting
Excel remains a practical reporting tool for many healthcare organizations because it supports calculations, filtering, charts, pivot tables, and comparisons across reporting periods.
A structured Excel workbook can organize information into separate worksheets instead of combining every metric into one large table.
For example, a monthly reporting workbook could contain:
Executive Summary: Key performance indicators and month-over-month comparisons.
Patient Volume: Visits by date, provider, location, and visit type.
Scheduling: Completed appointments, cancellations, rescheduled visits, and no-shows.
Referral Tracking: Referrals received, patient contact attempts, records status, scheduling outcomes, and completed visits.
Billing: Charges, claims submitted, payments, adjustments, and denials.
A/R Aging: Outstanding balances grouped into defined aging periods.
Provider Reporting: Selected productivity and operational measures by provider.
Quality Reporting: Measure definitions, eligible populations, numerators, denominators, and reporting periods where applicable.
The workbook should include clear column names, consistent status values, documented formulas, and appropriate data validation. Reports should be reconciled with their source systems before being used for important decisions.
For practical guidance, see How Can Physicians Use Excel for Practice Reporting? and How Do I Create a Medical Practice Dashboard in Excel?.
We also have an additional resource on Excel for Practice Reporting.
4. Measure Physician and Practice Performance in Context
Physician productivity reporting helps practices understand workload, patient volume, and operational patterns. However, productivity should not be judged using a single number.
Depending on the specialty and reporting objectives, a practice may examine:
- Completed encounters per provider
- New-patient and follow-up visit volume
- Visits per clinical session
- Available and utilized appointment slots
- Cancellation and no-show patterns
- Documentation completion, where applicable
- Selected quality and patient experience measures
Comparisons should account for differences in specialty, patient complexity, appointment length, clinical responsibilities, and provider schedules.
For example, two physicians may see different numbers of patients because they provide different types of care. A raw visit count alone may not represent the quality, complexity, or overall value of their work.
Practice leaders should therefore define the purpose of each measure and review the results alongside relevant operational context.
Read more about How Do Doctors Track Practice Performance? and How Do You Measure Physician Productivity?
5. Monitor Appointment Scheduling and No-Show Rates
Appointment reporting helps practices understand how scheduled visits translate into completed patient encounters.
Consider a practice that schedules 1,000 appointments during a month and records 70 no-shows. If the practice uses all 1,000 scheduled appointments as the denominator, its no-show rate is 7%.
No-show rate = No-show appointments ÷ Defined scheduled-appointment population × 100
The denominator must be clearly defined. Practices should consistently decide how to handle cancelled appointments, rescheduled visits, and other appointment statuses.
Useful scheduling measures include:
- Scheduled appointments
- Completed appointments
- Patient cancellations
- Office cancellations
- Rescheduled appointments
- No-shows
- Appointment lead time
- Time between referral receipt and scheduling
Tracking these measures over several months can help reveal patterns by provider, location, appointment type, or time of day.
Once a pattern is identified, the practice can investigate possible improvements, such as reviewing reminder processes, appointment availability, or patient communication procedures.
Read our guide to How Do You Calculate Medical Practice No-Show Rate?
6. Use Referral Analytics to Understand Patient Access
Referral management is especially important for specialty practices that receive patients from primary care providers, other specialists, hospitals, or community practices.
Counting referrals alone does not show whether patients successfully progress through the scheduling process.
A more useful approach tracks each referral through defined stages:
- Referral received
- Referral reviewed
- Patient contacted
- Required records requested or received
- Insurance requirements reviewed, where applicable
- Appointment scheduled
- Appointment completed, cancelled, or marked as a no-show
- Follow-up or recovery action documented when appropriate
This workflow helps practices identify pending referrals, delays, incomplete records, unsuccessful contact attempts, and appointments that require follow-up.
A referral report can also compare referral sources by volume and subsequent appointment outcomes. These comparisons should account for reporting periods and differences in referral type so that the results are meaningful.
For example, a high referral count does not automatically mean a referral source produces the highest number of completed visits. Tracking the entire process provides a clearer picture.
Any exchange of patient information must follow applicable privacy requirements and authorization procedures.
Learn more about How Do You Track Referral Conversion?
7. Understand Medical Billing and Revenue Cycle Performance
Financial reporting helps physicians and administrators understand how services move through the revenue cycle, from charges and claims to payments and outstanding balances.
Useful reporting categories include:
- Charges submitted
- Claims submitted and processed
- Payments received
- Contractual adjustments
- Claim rejections
- Claim denials
- Patient balances
- Insurance balances
- A/R aging
- Collections against defined targets
These measures answer different questions. For example, charges represent billed amounts, while payments represent money received. Neither figure alone provides a complete picture of financial performance.
A practice should also distinguish between a rejected claim and a denied claim according to its reporting definitions and source-system classifications.
A/R reports can group outstanding balances into periods such as 0–30, 31–60, 61–90, and 90-plus days. Consistent aging rules help teams identify balances that may require additional review.
The goal is to identify trends and follow-up opportunities, not simply to generate a monthly financial summary.
Read How Do You Measure Medical Practice Revenue? and What Should Be Included in a Medical Billing Report?.
8. Track Claim Denials and Identify Recurring Issues
Claim denials can affect reimbursement, staff workload, and the time required to resolve outstanding claims.
A useful denial report may include:
- Total claims submitted
- Number of denied claims
- Denial rate
- Denial reason
- Payer
- Date of service
- Claim status
- Corrective action
- Appeal or resubmission status
- Amount associated with denied claims
A practice can then examine whether certain denial reasons occur repeatedly or whether particular payers, services, or workflows need closer attention.
For example, recurring issues related to missing information, eligibility, authorization, or coding may warrant a review of the relevant workflow. The correct response depends on the actual denial reason and payer requirements.
Denial reporting should distinguish claims from individual claim lines and should use consistent reporting periods and definitions.
Explore How Do You Track Healthcare Denials?.
9. Improve Administrative Workflows Through Analytics
Healthcare analytics can also help identify administrative tasks that create delays or require repeated follow-up.
Examples include:
- Incomplete referral records
- Pending insurance verification
- Prior authorization follow-up
- Unsuccessful patient contact attempts
- Appointment rescheduling
- Unresolved billing tasks
- Delayed documentation
- Repeated data entry
Tracking task status, responsible teams, completion dates, and reasons for delay can help managers understand where work accumulates.
However, reporting should be designed to support staff and improve processes rather than create unnecessary monitoring or duplicate documentation. Whenever possible, teams should use existing system data instead of manually maintaining multiple versions of the same information.
A practice should also define which tasks need escalation and how outstanding work will be reviewed.
Learn how Healthcare Analytics Can Improve Practice Performance and how Data Analytics Can Reduce Administrative Burden in Healthcare.
10. Establish Reliable Reporting Standards
Even the most attractive dashboard is unreliable if the underlying data is inaccurate or inconsistent.
Before publishing a report, confirm:
Data source: Identify the system or spreadsheet from which each metric originates.
Reporting period: Use a consistent start date, end date, and time zone where relevant.
Metric definition: Document exactly how each KPI is calculated.
Data quality: Check for missing fields, duplicate records, and inconsistent statuses.
Reconciliation: Compare totals with the source system and investigate material differences.
Access control: Limit patient-level information to authorized users.
Privacy and security: Follow applicable HIPAA requirements, contractual obligations, and other relevant privacy and security rules.
Review process: Assign responsibility for validating and updating each report.
For clinical quality reporting, measure specifications may also define the eligible population, numerator, denominator, exclusions, exceptions, and measurement period. Practices should follow the specifications relevant to the measure and reporting program rather than relying on an improvised calculation.
How Columbus Medical Technology Solutions Supports Healthcare Reporting
Columbus Medical Technology Solutions (CMTS), associated with Columbus Technology Solutions, focuses on healthcare administrative operations and technology-enabled support.
A structured reporting approach can help a medical practice organize operational information into useful summaries for review by authorized practice leaders. Depending on the agreed scope of work and the information systems available, this may include patient scheduling reports, referral tracking, administrative workflow monitoring, billing-related reporting, and practice performance summaries.
The objective is to help practices maintain consistent reporting processes, identify outstanding work, and understand operational trends without treating every metric as a standalone result.
Effective reporting also depends on clear definitions, reliable source data, appropriate access permissions, and regular review by the practice.
Frequently Asked Questions
What healthcare data should a medical practice track?
Most practices can begin with patient volume, appointment outcomes, referral status, provider workload, billing activity, accounts receivable, and selected quality measures. The final selection should reflect the specialty, practice objectives, and available data.
Can doctors use Excel for healthcare reporting?
Yes. Excel can support calculations, pivot tables, charts, filters, and monthly comparisons. It is particularly useful when data can be exported reliably and the workbook has documented definitions and appropriate access controls.
What is the difference between healthcare analytics and healthcare reporting?
Healthcare reporting presents information in organized formats, such as tables and dashboards. Healthcare analytics goes further by examining patterns, relationships, and changes to help explain performance and support decisions. The two often work together.
How often should a medical practice review its KPIs?
Many operational and financial reports are reviewed monthly, while some scheduling, billing, authorization, or referral workflows may need more frequent monitoring. The review schedule should reflect the importance and urgency of the measure.
Does every medical practice need a business intelligence platform?
No. A smaller practice may begin with well-controlled Excel reports or built-in EHR reporting. More advanced tools may become useful when the practice needs data from multiple systems, automated updates, more complex analysis, or reporting across several locations.
Conclusion
Healthcare data analytics is most useful when it connects daily operations with clear, measurable questions. Patient volume reports show activity, scheduling reports reveal appointment patterns, referral analytics help track patient access, and billing dashboards provide visibility into claims and outstanding balances.
Excel and EHR dashboards can provide a practical starting point, provided the data is accurate, metrics are clearly defined, and access to sensitive information is properly controlled.
For physicians and practice administrators, the objective is not to measure everything. It is to identify the information that matters, review it consistently, and use the findings to guide appropriate action.
Explore the linked CMTS resources throughout this guide to learn more about individual healthcare KPIs, reporting methods, dashboards, referral workflows, and revenue cycle analytics.